The Polarized Voting Patterns Only Sharpened in 2020
By Kollengode S Venkataraman
In twelve presidential elections prior to 2016, Pennsylvania voted Democratic in eight — Humphrey (1968), Carter (1976), Clinton twice (1992, 1996), Al Gore (2000), John Kerry (2004), and Obama twice (2008 and 2012); and Republican in four (Nixon in 1972, twice for Reagan in 1980 and 84, and for George Bush in 1988). The state voted Democratic in all the previous six presidential elections with a comfortable margin of well over 100,000 votes. So, even though we are socially and culturally conservative, politically we are left-leaning in the aggregate. In 2016 we chose President Trump with a thin margin of 46,000 votes.
So, in 2020, for both Democrats and Republicans, Pennsylvania was a must-win state to hit the magic 270 number in the electoral votes. Crucial for GOP for retaining the White House for four more year, and for Democrats, for dislodging the divisive incumbent. In American politics, retaining is lot easier than dislodging. No wonder, during this summer/fall, I received over 100 political phone calls, more of them from Democrats. Because of the Covid Pandemic, the primary season was subdued; no made-for TV jingoistic nominating conventions; no campaign rallies in summer/fall.
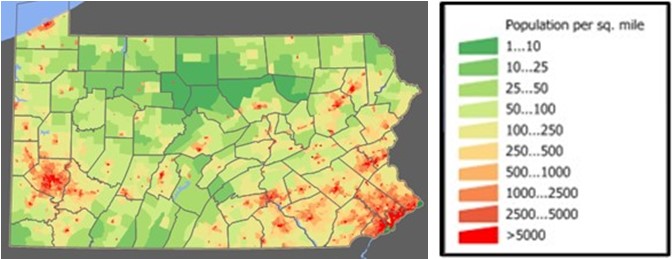
Opinion makers from both Right and Left told us that the country was sharply polarized politically as never before — between voters in densely populated urban areas and sparsely populated countryside; and between the college-educated and those without college degrees.
In the US, while the densely populated demographically diverse urban clusters are heavily “Blue,†sparsely populated relatively homogeneous rural counties are bright “Red,†with suburbs falling in between with a strong GOP streak. See the image above on the population density of Pennsylvania. Pennsylvania is typical on this measure.
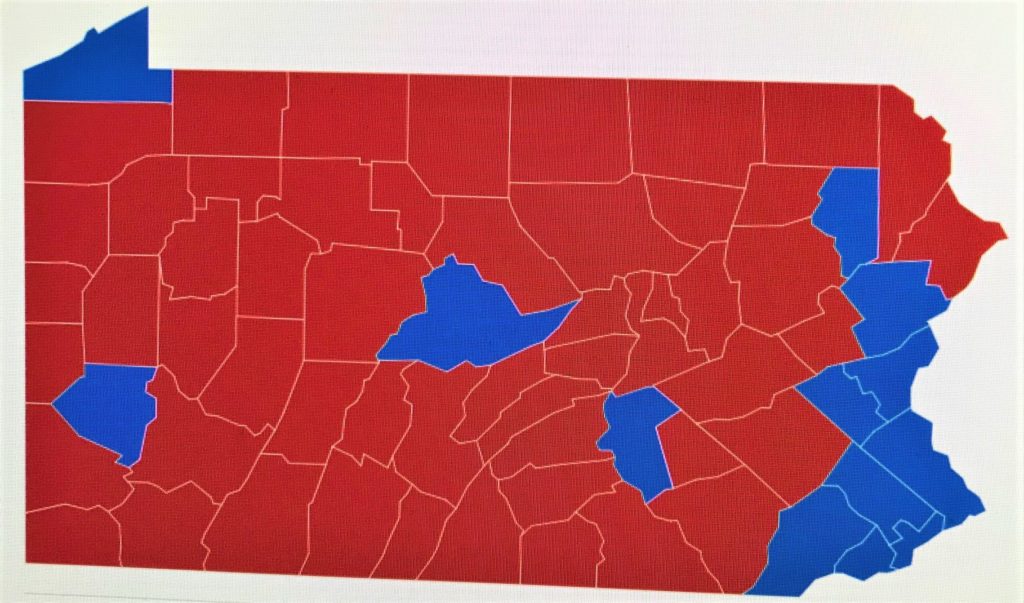
As shown in the map shown below major urban centers voted Democratic, while rural counties voted for Trump in the 2020 elections. But Trump’s polarizing, shrill rhetoric and mishandling of the pandemic, many believed, would make the college-educated, white-collar suburban voters to go for Biden in large numbers, making it easy for him to defeat Trump. At least, that is how I read the media coverage.
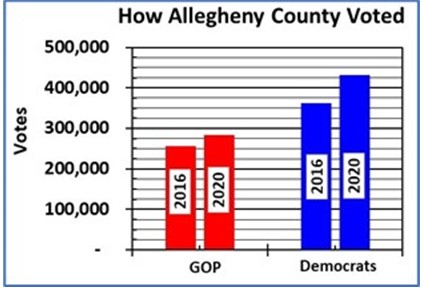
I live in Westmoreland County, adjacent to Allegheny County (which has Pittsburgh at its center). So, I compared the votes cast in counties around Pittsburgh in the 2016 and 2020 presidential elections, looking for a trend of suburban voters switching to Biden. What I saw surprised me. The bar chart below shows how Allegheny County voted in the last two presidential elections favoring the Democrats. While Republicans received ~255,000 in 2016, they got ~285,000 in 2020. But Democrats did much better: ~360,000 in 2016 vs.~430,000 in 2020). (numbers rounded to the nearest ‘000)
The bar chart below shows how the neighboring counties voted. All the aggressive campaigning by both the Democrats and the GOP folks had the desired effect. In all the counties around Pittsburgh, compared to 2016, both Republicans and Democrats got more votes.
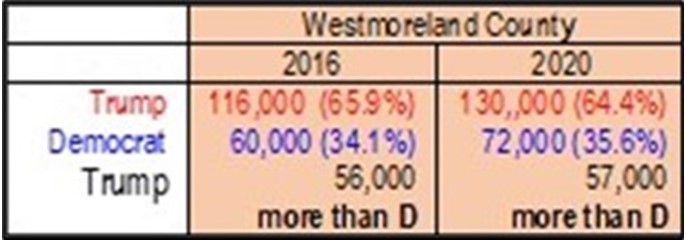
In addition, as the table further below titled “Westmoreland County” shows, in Westmoreland County, in both 2016 and 2020 Trump got almost the same number of more votes — 56,000 in 2016, and 57,000 in 2020 — than his Democratic opponent. The change in the voting pattern favoring Democrats was small (1.6%) between 2016 and 2020, and there was no windfall shift favoring Democrats.
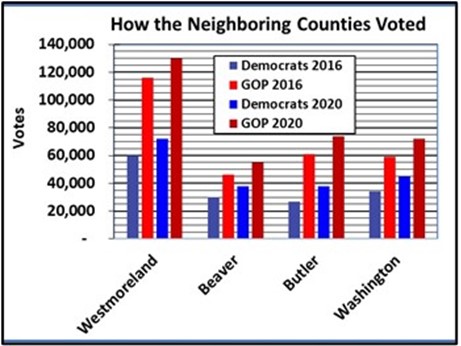
That is, Westmoreland County is still heavily Republican, Covid or No Covid, with almost 2:1 split favoring the GOP as before. This is despite the four years of Trump’s shrill rhetoric and lies, and despite his illogical approach to the pandemic ignoring all the advice from public health officials. This trend was seen in all suburban counties as shown in the bar chart on the side. While both parties increased their votes, the suburban counties continue to be heavily Republican in terms the vote split.
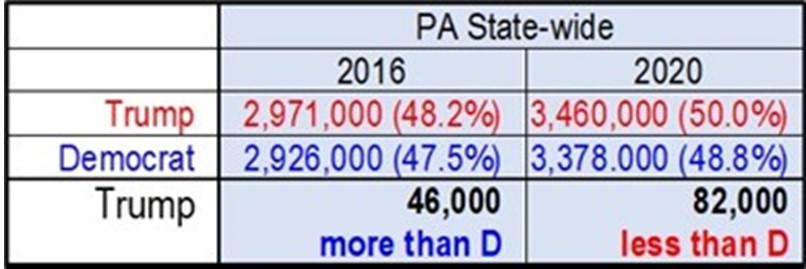
How the State as a Whole Voted: The table further below titled “PA State-Wide” compares the total votes for the entire Commonwealth of Pennsylvania in 2016 and 2020 elections. Again, here too, both parties got more votes for themselves in 2020 compared to what they got for 2016. In 2020, Republicans got 489,000 more votes (3,460.000 – 2,971,000) than what they got in 2016. Democrats did even better on this, getting 452,000 more votes in 2020 compared to 2016, with more votes coming from urban areas around Pittsburgh, Philadelphia, Harrisburg, Allentown, and State College. The net result of this aggressive state-wide campaigning resulted in Biden getting 82,000 more votes than Trump, thus bagging the crucial 20 delegates.
The contrasts in the voting patterns between the densely populated demographically diverse urban Allegheny County and the neighboring sparsely populated counties, shown in the two bar graphs above stand out. The urban areas favor Democrats, with the suburban counties heavily favoring Republican. This trend is the same in other urban areas such as Philadelphia, Harrisburg, State College, and Allentown. Sparsely populated and demographically homogeneous rural counties are even more sharply Republican. The (in)famous quote attributed to James Carville, “Pennsylvania is Philadelphia [in the east] and Pittsburgh [in the west] at the ends, with Alabama in between,†has not changed one bit in the last 30 years, even with Covid-19 and even with Trump in the White Hose.
This Urban-Suburban-Rural divide is an enduring trend all across the 50 states in the US. This is worrisome. Under democracy, nation-states so sharply polarized are difficult to govern. Deeply entrenched suspicion and vested interests make compromises difficult.
One glaring example of this vested interest was how the GOP-controlled state legislature in Harrisburg shamelessly drew and re-drew the maps for the Congressional districts favoring the GOP so that they got a 13/5 split in the Congressional delegation. This was despite the state as a whole has been voting 45:55 split between the two parties in presidential elections. Three years ago, the Commonwealth High Court had to intervene to redraw the congressional districts to make it more representative. After this, in the last two elections, the delegate split between GOP and Democrats is 9/9, more reflective of the state’s voting pattern.
Campaigns are fought from ideological extremes with simplistic and contrasting slogans that can be fitted into bumper stickers and placards. However, governing is possible only from somewhere in the middle, with the necessity and willingness to make compromises, which are always anathema to ideologues on both sides. Sadly, such political polarization all across the nation has led to social and cultural polarization as well. Already, Urban, Suburban and Rural Americas live in their own isolated and insulated silos of sharply different value systems, priorities and perceptions with very little interactions among each other, with mutual condescension and disdain. This often morphs into mutual animosity towards each other when taxation and resources allocations are debated and legislated by state assemblies, making governing more difficult. END
